$60,090 walks out the door every time a nurse resigns.
Nursing Workforce Planner gives nurse managers and CNOs a dashboard to track turnover, benchmark BLS wages against your region, and surface retention risk before the resignation letter arrives — turning a million-dollar attrition crisis into a tracked, preventable metric.
- No credit card required · 14-day free trial
- BLS OES wage data updated annually · 16.4% national RN turnover benchmark included
- NSF 2026 Report: avg. $60,090 cost per departing RN
The retention crisis is costing your facility more than you know.
Turn a $60,000-per-departure crisis into a dashboard metric.
Turnover tracking + cost calculator
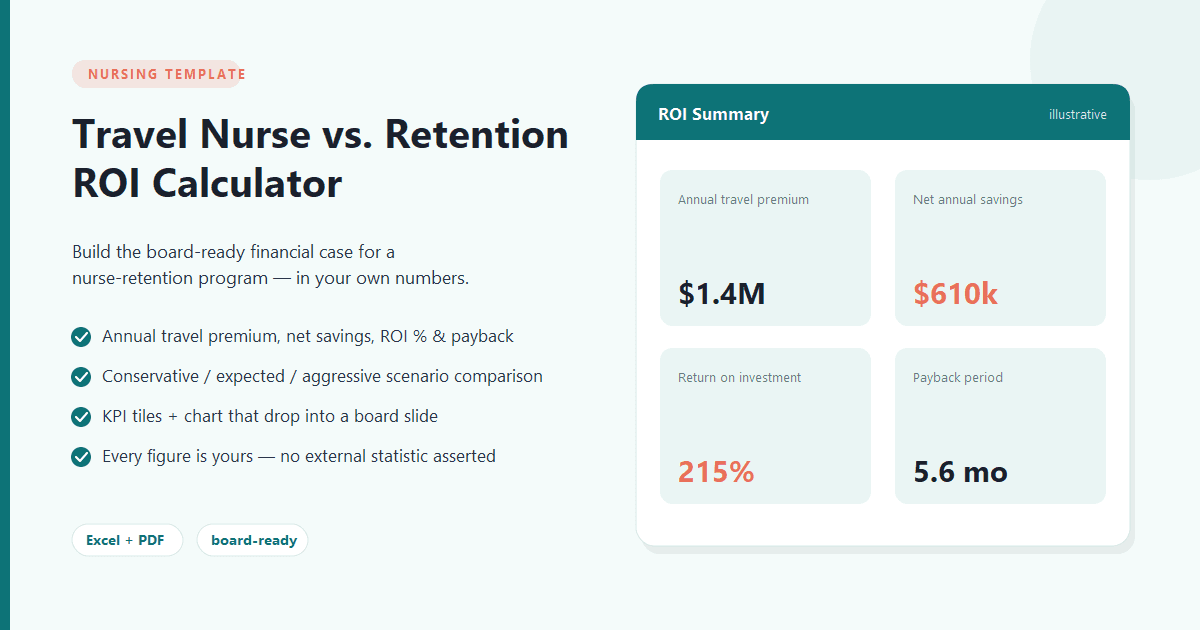
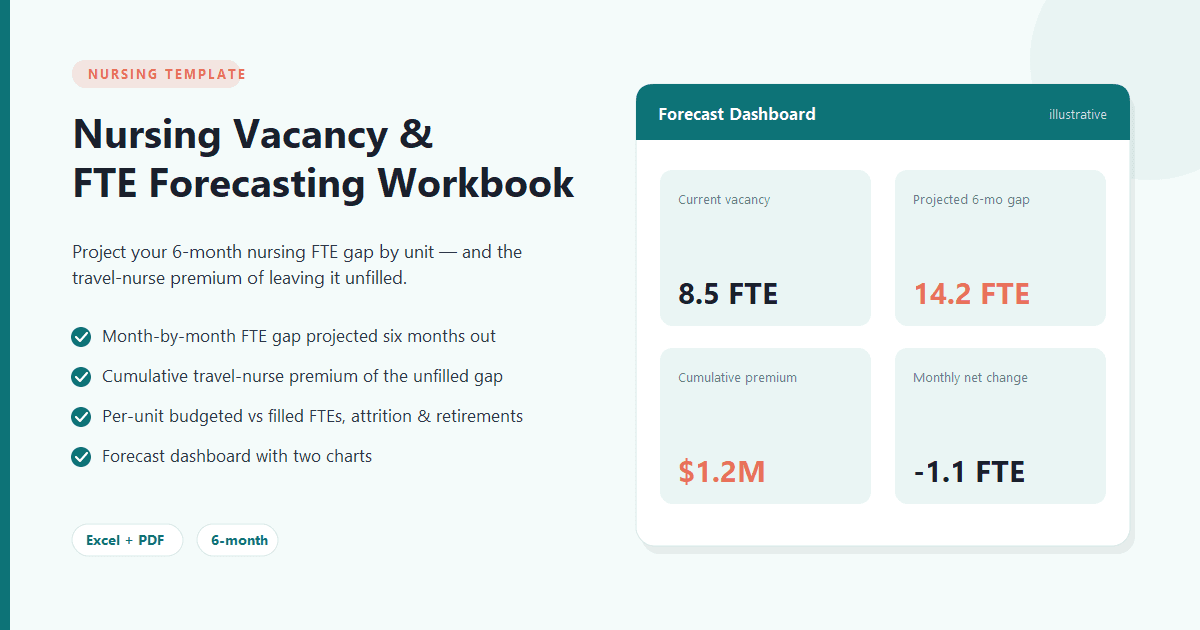
Rolling 12-month turnover rate by unit and role, benchmarked against the NSI 16.4% national average. The annualized cost of departures is the first number on your dashboard.
BLS OES wage benchmarking
Regional median and percentile wages for RN (SOC 29-1141) and LPN/LVN (SOC 29-2061) by state and metro area, compared against your internal pay bands. Wage-gap alerts fire automatically.
Retention risk scoring + forecasting
Formula-based retention risk score per unit (0–100) from five observable inputs: overtime hours, vacancy rate, days-open average, departure trend, and wage gap. Plus a 6-month vacancy forecast with travel nurse premium cost projection.
Up and running in 30 minutes.
Configure your facility
Enter your facility type, FTE targets by unit, BLS benchmark region, and internal pay bands. The dashboard populates instantly.
Log headcount and departures
Enter nursing staff by unit (RN/LPN/LVN), FTE weight, and employment status. Log departures with reason codes as they occur. Analytics update in real time.
Act before the resignation letter
The retention risk score flags high-risk units in red. The wage-gap alert identifies positions below the BLS regional median. The monthly PDF report goes to your CFO with the cost-of-inaction number already calculated.
How much is turnover costing your facility?
Run the full calculatorStart with a template while you evaluate the platform.

Practical guides for CNOs and nurse managers.
Priced for the 50–300-bed segment.
All four tiers fall below a typical CNO's $10,000/year no-PO threshold.
Preventing one RN departure pays for 17 years of the Professional plan.
$60,090 per departure ÷ $3,490/year Professional plan = 17x ROI on a single prevented resignation.
NSI 2026 Data · BLS OES Regional Wages · No PHI, No EHR Integration · 14-Day Free Trial
CNO insights and workforce data, delivered to your inbox.
Practical guides on turnover analytics, BLS wage benchmarking, and nursing retention — subscribe using the form in the footer below.